Energy Background
Energy production within countries can originate from various resources such as natural gas, oil, hydro, bioenergy and waste, solar, wind, and tidal energy. Norway, for instance, produces surplus energy, which it exports to other countries. As a reliable energy partner of the European Union, Norway plays a pivotal role in the global oil and gas supply, particularly in meeting European demand. In 2020, Norway exported 87% of its total energy production (approximately 207.9 Mtoe), with the remaining 13% (around 27.4 Mtoe) supplied to its domestic market. Natural gas (47.2%) and oil (45.8%) comprised the largest share of Norway’s energy production. However, hydro (44.3%) represents the largest source of energy for domestic consumption, followed by oil (31.6%) and bioenergy and waste (7.1%).
Since 2000, Norway’s total energy production mix has evolved from being oil-dominated to nowadays being spearheaded by natural gas, followed by oil and a small share in hydro. Notably, Norway’s energy production is substantially higher than its domestic energy supply, being up to seven times greater in 2020. Surplus production is particularly significant for natural gas production, with total production being up to 21 times higher than domestic supply.
As of 2020, Norway’s energy demand is primarily driven by electricity (approximately 48%), followed by oil (36%) and bioenergy and waste (6.8%). In the residential sector, electricity accounts for up to 84% of demand, whereas in the industrial sector, it makes up around 45%. The transportation sector faces significant challenges in transitioning to renewable energy; however, oil constitutes just 86% of the transport sector’s energy needs, one of the lowest among IEA members, thanks to the high adoption of electric vehicles (EVs). Consequently, residential and building sector energy demand is predominantly met by electricity, while the industrial sector’s demand is almost equally split between electricity and oil. In the transportation sector, oil remains the primary energy source.
Most of Norway’s electricity is generated from hydropower, followed by wind power (around 10 TWh) and other sources (less than 5 TWh). Typically, one might expect energy consumption to rise with GDP growth; however, this hasn’t been the case for Norway. According to the IEA Norway 2020 report, from 2009 to 2019, Norwegian GDP increased by 16%, while total energy consumption rose by only 3%. Energy efficiency in a country can be measured by dividing total energy consumption by GDP. Norway aims to reduce its energy intensity by 30% by 2030 compared to 2015 levels.
Given that electricity accounts for approximately 48% of final energy consumption in Norway, understanding its generation and structure is crucial. This knowledge not only supports Norway’s energy needs but also offers a valuable model for other countries striving to transition to cleaner energy sources. By studying Norway’s approach, we can learn how to optimize electricity use and reduce reliance on fossil fuels, thereby fostering a more sustainable global energy landscape.
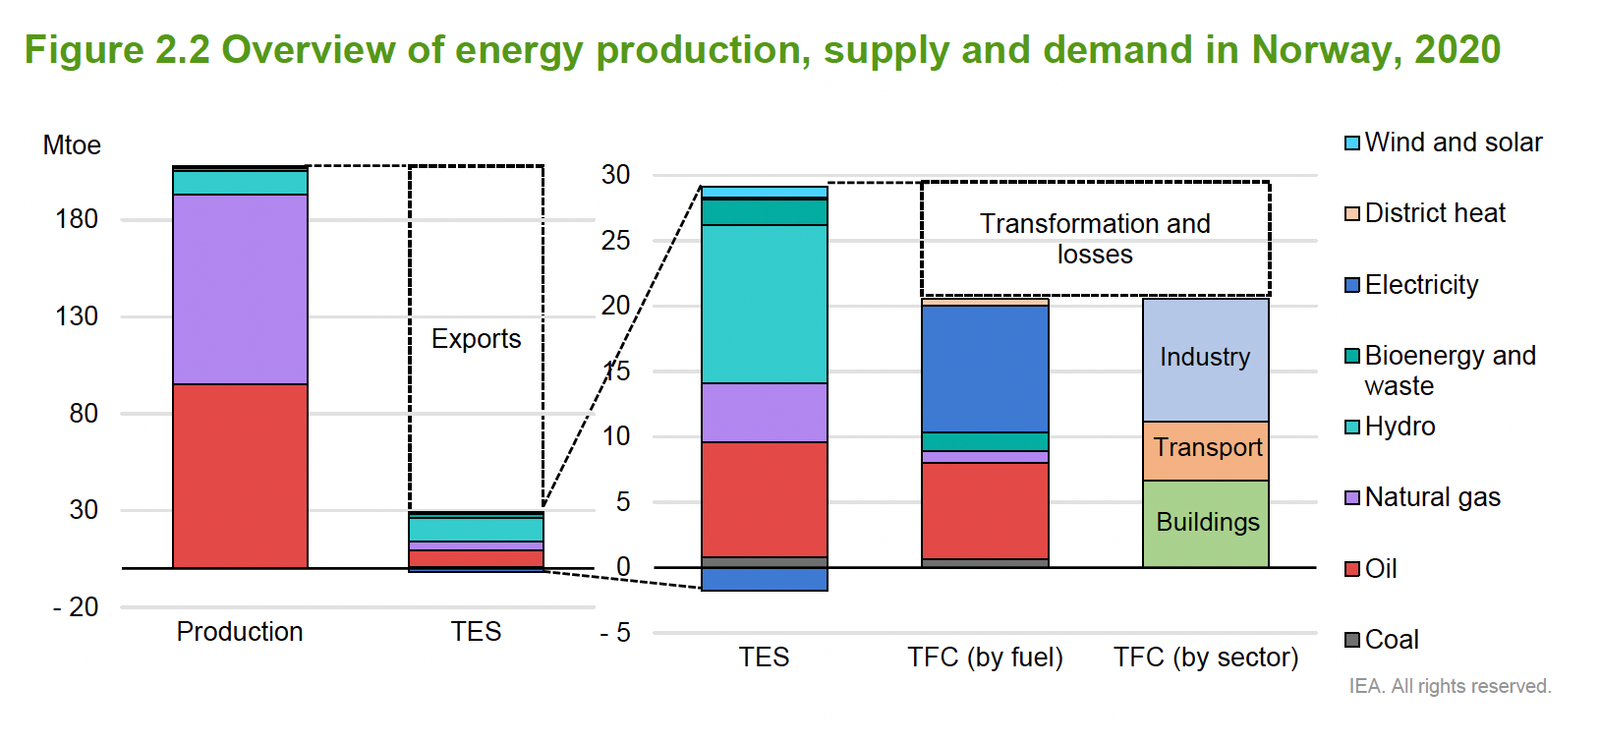
Note: As you can see in the chart above, most energy produced in Norway is exported abroad. From the energy in the domestic supply, electricity comprises around 48% of the total final energy consumed.
Electricity Production in Norway
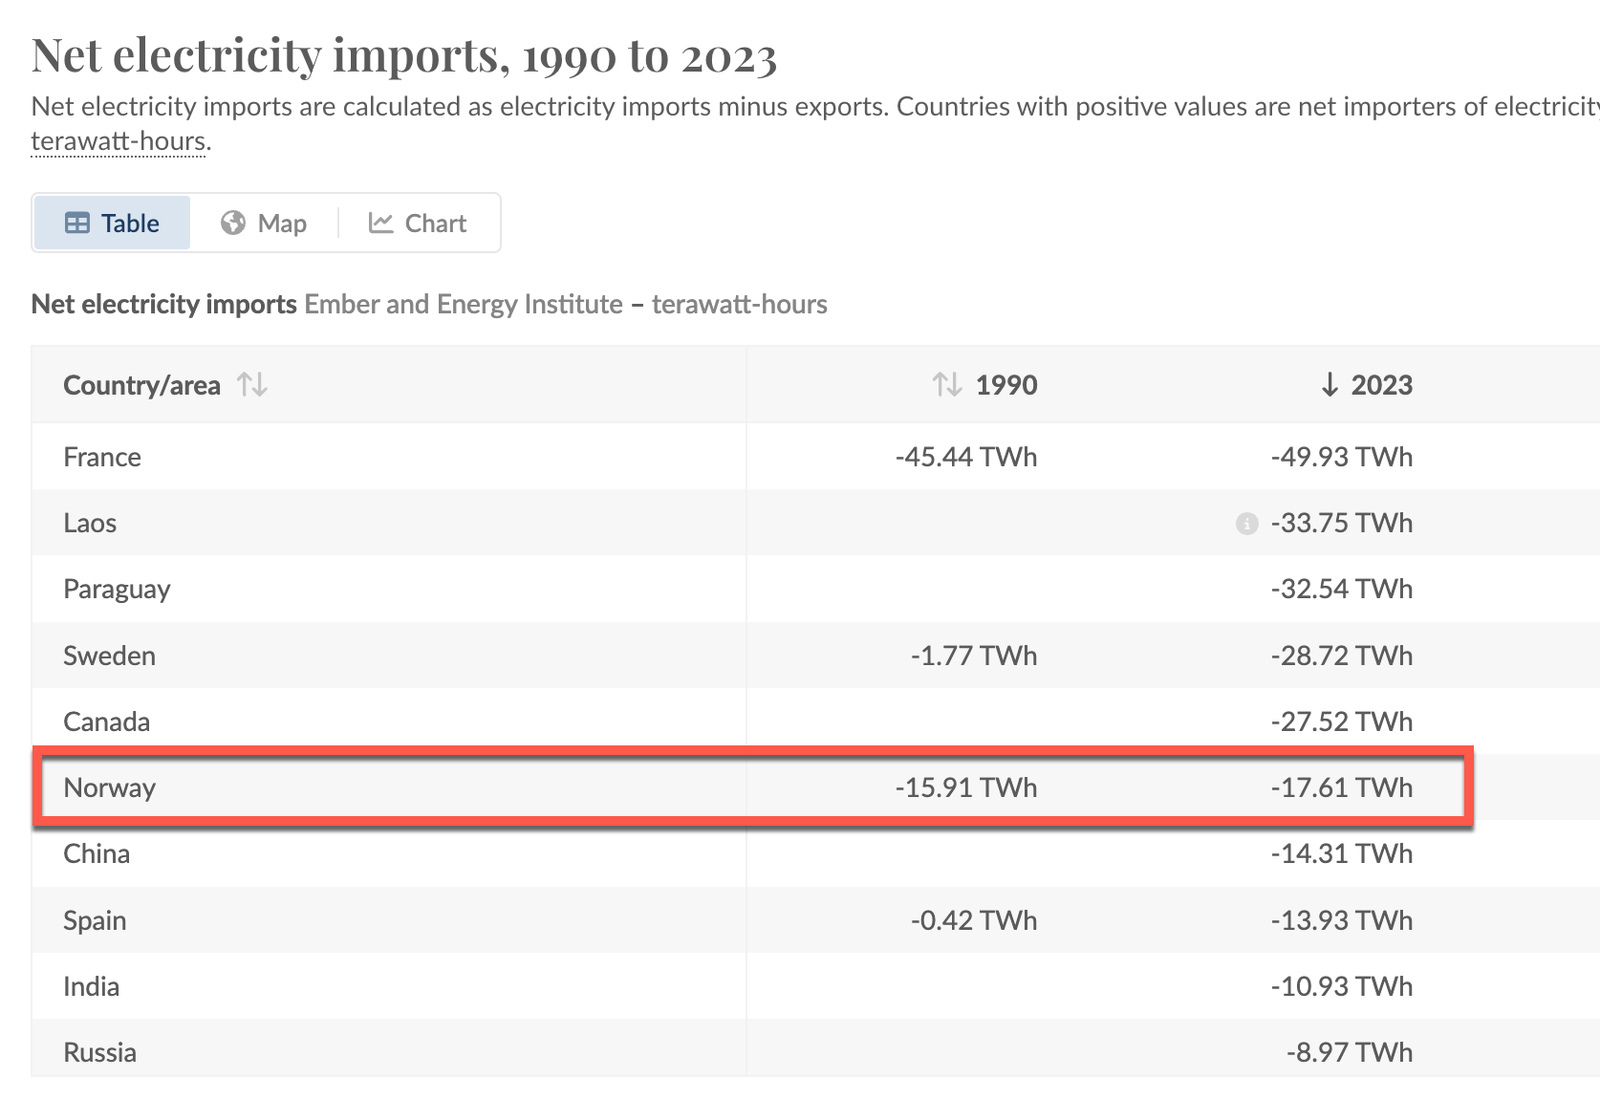
Norway is a prime example of a country benefiting from long-term strategic thinking and abundant natural resources. Historically, Norway deregulated its energy market in the early 1990s, resulting in a net energy surplus over the past three decades. In 2023 alone, Norway recorded net electricity imports of -17.61 TWh, affirming its status as a net electricity exporter. Few countries surpass Norway in electricity exports, with notable exceptions including France, Paraguay, Canada, and Sweden.
Norway’s success is largely attributed to its unique and strategic focus on hydropower. To provide context, as of 2023, Norway boasts an installed power supply capacity of 39,703 MW, with 33,691 MW (approximately 85%) derived from hydropower. This positions Norway as a global leader in renewable energy-based electricity generation. Norway’s capacity factor is around 45%, based on a long-term average electricity production of 156 TWh per year. This figure places Norway ahead of countries like Chile, Austria, and the Philippines, but behind Sweden, the Netherlands, and Mexico with up to 94.42 TWh annually. Leading the global scale are China with 2,355 TWh, the USA with 1,176 TWh, and India with 469.46 TWh. In peak years such as 2021, Norway’s electricity production reached 157.1 TWh. When we analyze per capita electricity generation, Norway emerges as the second country with the largest figure, boasting 28,056 KWh. This impressive statistic places Norway right behind Iceland, which leads with a staggering 53,285 KWh per capita. Even countries like Canada, Sweden, and Finland, with per capita figures around 15,000-16,000 KWh, lag behind Norway. This highlights Norway’s exceptional efficiency in harnessing its natural resources to supply high levels of electricity relative to its population.
Additionally, Norway’s electricity production benefits from water storage reservoirs, capable of storing up to 87 TWh. This adaptability allows Norway’s power supply to align with market and consumption patterns. During dry years with low water inflow, reservoirs compensate for the production shortfall. The largest reservoir, Blåsjø, has a capacity of 7.8 TWh, representing about 5% of the total annual electricity production. Hydropower electricity in Norway is thus a flexible tool, adaptable to price and market conditions. During periods of high electricity prices and consumption, hydropower plants with large reservoirs increase production. Conversely, during times of high water inflow and low electricity prices, water is conserved in strategic reservoirs for future use, ensuring stored electric capacity.
Norway’s leadership in hydropower began in the early 1990s, though some hydro plants were completed as early as the 1960s and 1970s. Research indicates that power plants require maintenance approximately every 50 years, including the replacement of individual components due to normal wear and tear. In certain cases, such as with the Lio Power Plant, a comprehensive upgrade or complete replacement might be necessary.
The Norwegian government must consider these renewal needs for the future, as they entail both direct costs—such as replacement parts, labor, and administrative expenses—and indirect costs, including temporary reductions in capacity, the risk of supply failing to meet demand, and income loss for the plant over a period of four to six months.
Additionally, Norway’s capacity to construct large dams and hydro plants is constrained by political and environmental factors. According to Statkraft, Europe’s largest hydro producer, hydropower is a highly valuable resource due to its ability to store water and flexibly generate power. This flexibility avoids the substantial costs associated with starting up or shutting down nuclear or thermal plants, which typically operate over extended periods to provide base energy supply. However, hydropower has environmental impacts that must be carefully evaluated, and new dams are often situated in protected areas, presenting challenges for development.
Solar and wind energy are intermittent power sources with installed capacities of 153 MW and 5,073 MW, respectively. Solar energy is primarily driven by private investments from industrial facilities and households aiming to cover their own consumption. Wind energy can generate up to 16.9 TWh in a typical year, accounting for approximately 10.8% of the annual average production, with a national capacity factor of 32.9%. This output is highly variable and unpredictable, and the majority of wind capacity is onshore. Lastly, in 2023, thermal power plants in Norway contribute a mere 1.5% to the total production capacity. The majority of electricity is generated based on industry demand from a diverse array of sources, including municipal waste, surplus heat, oil, natural gas, and coal.
Electricity Grid in Norway
Norway boasts a highly developed electric grid that efficiently transports electricity over long distances and facilitates trade with other European countries, positioning Norway as a reliable partner for the European Union in meeting energy demands. The grid infrastructure is categorized into three main levels: transmission grids, regional distribution grids, and local distribution grids.
Firstly, the transmission grids are composed of high-voltage transmission lines, typically ranging from 300 to 420 kV, and are managed by Statnett, the designated Transmission System Operator (TSO). These grids span approximately 12,000 km and serve to connect large-scale electricity production facilities and consumption centers. They also link regional distribution grids and international interconnectors, thereby enabling the import and export of electricity.
Secondly, regional distribution grids function as intermediaries between the high-voltage transmission grids and local distribution grids. Operating at medium voltages between 33 to 132 kV and extending over approximately 19,000 km, these grids also supply electricity to industrial consumers and other high-intensity electricity users, such as oil and gas companies.
Lastly, the local distribution grids are responsible for delivering electricity directly to end-users, including households, small businesses, and local industries. These grids operate at high voltages around 1 kV and are the most extensive, with a total length of 101,000 km. For low voltage users, such as households, the supplied voltages are typically around 400 V or 230 V.
Norway’s electric grid is a sophisticated and multi-tiered system that ensures efficient energy distribution and international trade, thereby underscoring Norway’s role as a key player in the European energy market.
Norway undertook the unbundling of its grid companies as part of its market deregulation strategy, transitioning vertically integrated entities—encompassing electricity generation, transmission, and trading—into distinct legal and functional units. But what does this entail precisely? Grid operation, electricity production, and trading must be conducted by separate companies, with no overlap in management or controlling interests among them. Financial and operational independence are critical aspects of daily management and risk frameworks within each company. This restructuring promotes fair and transparent competition, leading to more competitive prices for consumers. Additionally, specialization within specific areas of the supply chain enables greater economies of scale and operational efficiencies compared to a single company managing all three activities. Finally, involving multiple owners, including private stakeholders, in grid companies helps delineate market-based and monopoly activities for regulators and policymakers.
Note: This unbundling requirement applies only to companies with more than 10,000 clients–currently there are 63 exempted DSO companies out of 93 companies in Norway.
To balance supply and demand, Norway has developed a well-established power market that utilizes daily prices through a day-ahead market, enabling efficient planning for expected consumption and aligning production with optimal pricing. Additionally, Statnett collaborates closely with the European Network of Transmission System Operators for Electricity (ENTSO-E) to sell electricity and reserve capacity to other EU countries. For instance, in 2023, Norway allocated 9,000 MW of capacity, with 4,000 MW to Sweden, 1,400 MW to Germany, 1,400 MW to the UK, 1,600 MW to Denmark, and 700 MW to the Netherlands. Despite a potential transmission capacity of 80 TWh per year, historical utilization has been approximately 38 TWh, even with the recent commissioning of new transmission lines such as NordLink and North Sea Link.
Grid Regulations
As previously mentioned, Norway’s electricity market operates independently and is no longer vertically integrated. Electricity generation and trading are market-based activities, whereas energy transmission and distribution function as regulated monopolies. This structure is governed by the Norwegian Energy Act. Transmission and distribution (T&D) companies are designated as natural monopolies due to substantial entry barriers and significant startup costs. Additionally, large-scale investments yield economies of scale, enhancing efficiency in meeting market demands. Consequently, the Norwegian government has implemented stringent regulations to safeguard social welfare and consumer interests.
Under this framework set by the Norwegian Energy Regulatory Authority (NVE-RME), transmission companies are assigned a revenue cap, allowing them to earn sufficient revenue to cover operational and fixed costs, such as depreciation, and to secure a reasonable return on invested capital. These revenue caps serve to limit the potential for excessive earnings and incentivize grid companies to seek cost-reduction strategies to improve their profit margins.
Grid companies primarily generate revenue through regulated grid tariffs. These tariffs are fees collected from end-users and electricity generation companies for access to transmission and distribution lines. The quality of service provided by grid companies can significantly impact their revenue. Under the CENS/KILE scheme, end users experiencing power outages exceeding 12 hours are entitled to compensation from the grid company.
Inspection and enforcement are crucial, with the NVE-RME serving as the ultimate supervisory authority for grid operations. The NVE-RME has the power to issue compliance and licensing orders that can influence the activities and profitability of grid companies.
Grid tariffs vary based on whether the entity is an energy producer or consumer. For energy consumers, it is crucial to distinguish between those connected to the primary transmission grid and those connected to regional or local distribution grids. Consumers connected to the main transmission grid typically incur lower costs compared to end-users on local grids, due to additional investment and operational expenses required to service these customers. For instance, the greater distance and increased electricity losses associated with delivering power to low-voltage consumers contribute to higher costs.
Energy producers, on the other hand, are subject to a fixed charge of 1.2 EUR/MWh in 2023. Factors such as adverse weather conditions, geographical distance from production sites, and economies of scale significantly influence grid tariffs.
Electricity Market
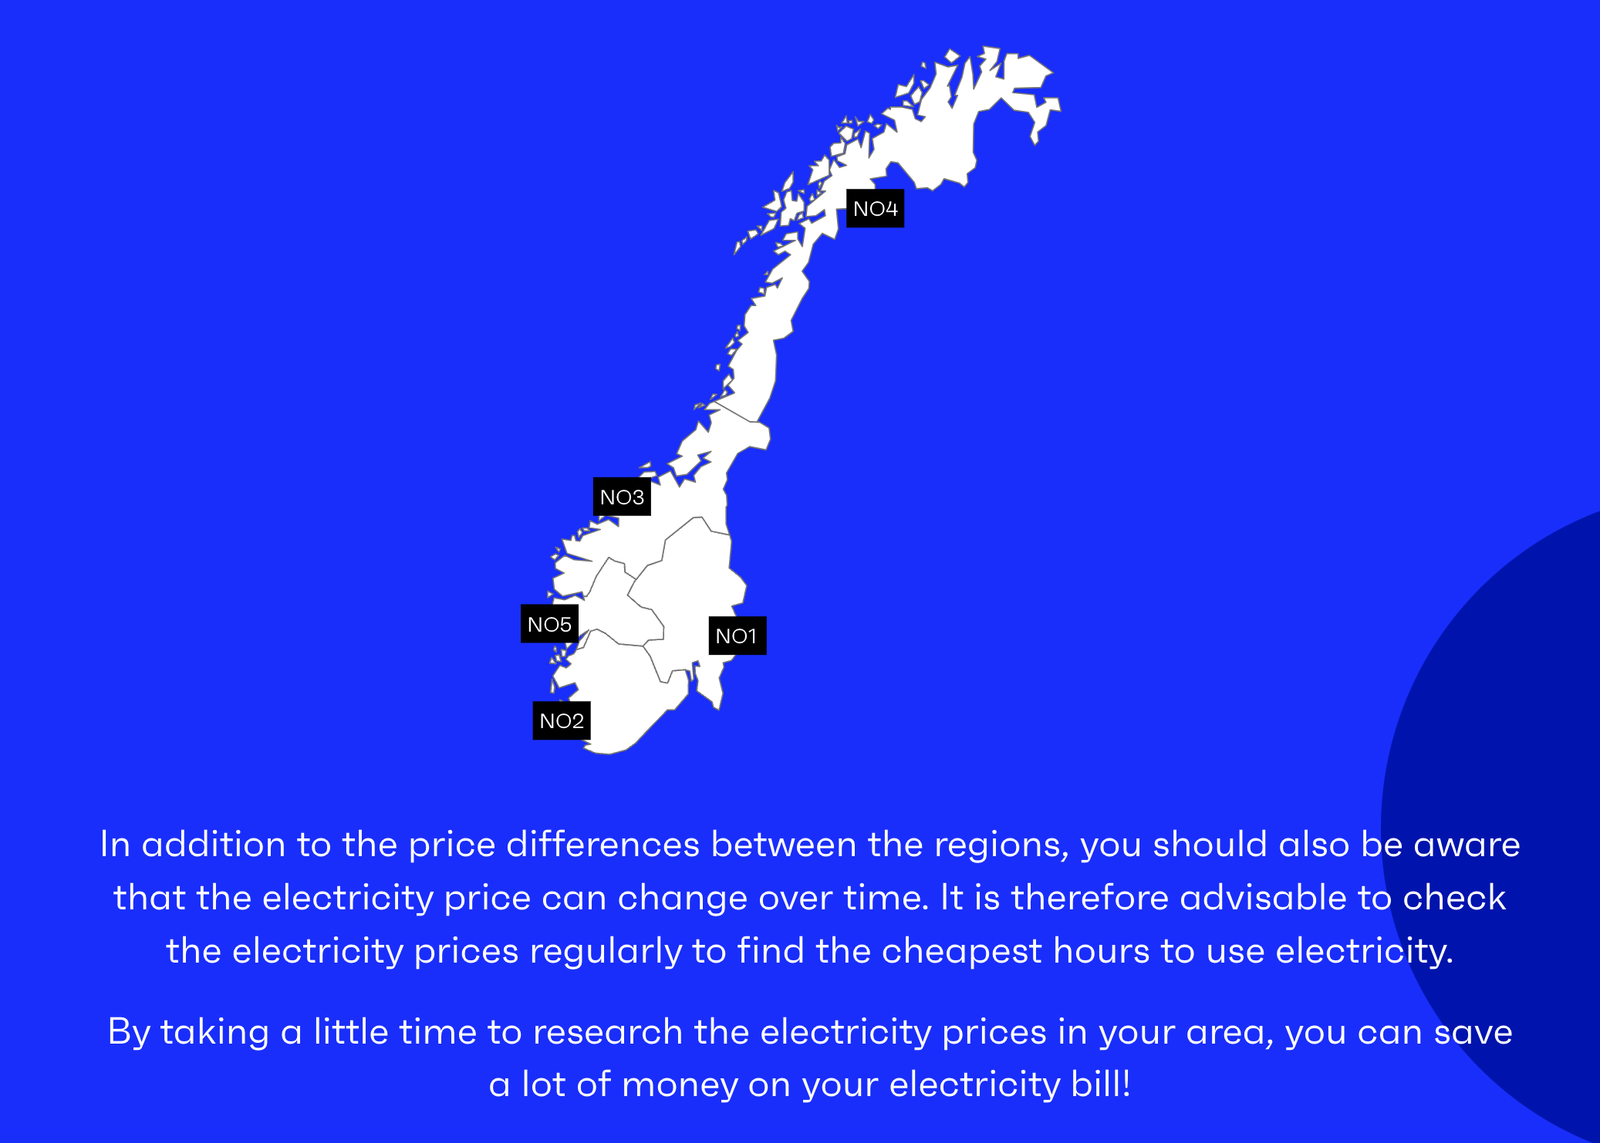
Electricity prices in Norway are segmented by regions known as “electricity price areas”. These zones are defined by the transmission system operator (TSO) where electricity is traded at a uniform spot price on a power exchange. Prices within each area are influenced by factors such as transmission capacity constraints, infrastructure availability, electricity demand and supply, weather conditions, and spot prices in other integrated Northern European markets like the UK, Germany, and Sweden.
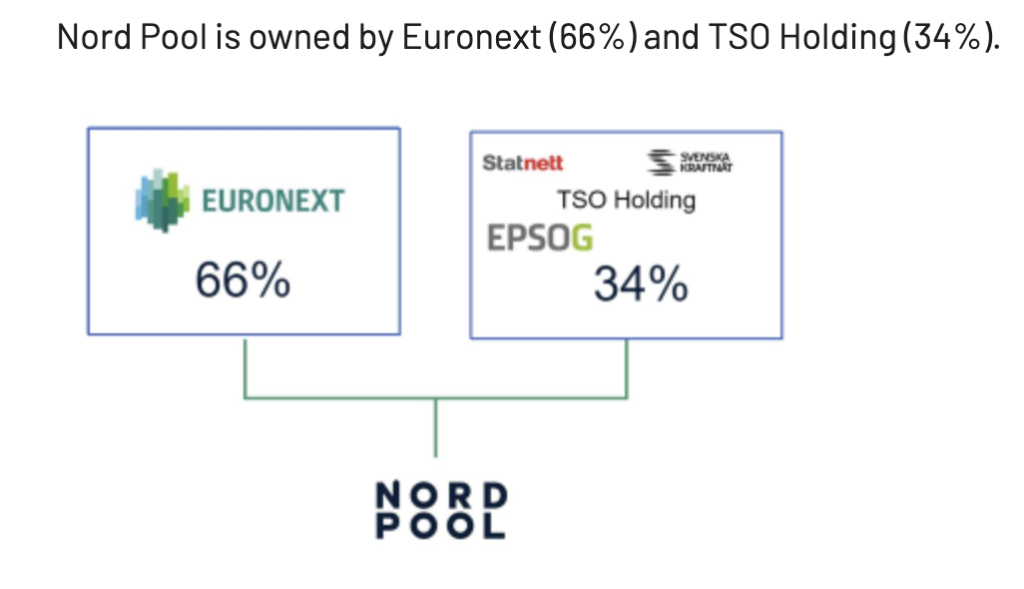
The Nord Pool Group, a power exchange specializing in the Northern European region with over 30 years of market experience, provides a common marketplace for physical and financial power trading. It promotes competition and price transparency and is currently owned by Euronext (66%) and TSO Holding (34%). TSO Holding includes state-owned Norwegian and Swedish companies Statnett and Svenska Kraftnat.
Norway is well integrated into the power market with other countries, including Sweden, Denmark, and Finland. In 2021, two new interconnectors were established: the Nord Link to Germany and the North Sea Link to the UK. Market coupling operates through implicit auctioning, which involves calculating prices and electricity flows between areas in the day-ahead market.
Markets can be divided into wholesale and end-user segments. In the wholesale market, large volumes are traded by institutions, power suppliers, brokers, and energy companies. Besides day-ahead markets, bilateral contracts with specific delivery dates and prices are common. The end-user market comprises household consumers (approximately 33%), industry (33%), and medium-sized consumers such as supermarkets and hotels (33%).
There are significant price differences between southern and northern regions of Norway. Nord Pool sets a general hourly price without considering grid transmission restrictions. However, each region in Norway (and other Northern countries) has unique local conditions. This includes limited transmission capacity and weather variations. Some areas may generate a surplus, while others may face deficits. Consequently, TSO companies impose congestion fees when transmitting electricity between areas. For instance, if a surplus area has a price of approximately 20 EUR/MWh and a deficit area has 40 EUR/MWh, the congestion fee will vary accordingly to balance the supply and demand.
Electricity wholesale price plays a crucial role both in the short term, including next day production and consumption, and in the long term, including seasonal maintenance planning and investment strategies. In the electricity market producers only know their costs and the market price once it is announced. Electricity imports can occur when the price of domestically produced electricity surpasses the import price. This leads to healthy competition where power needs can be met at lowest possible cost.
In the context of wholesale competition, Statkraft stands as the leading electricity market producer in Norway, with E-CO Energi following. Statkraft also possesses significant ownership stakes in other energy companies, such as Skagerak Energi and Eviny. When evaluating market concentration and the market share of each power production company, it is crucial to consider cross-ownership and average annual production capacity. Annual production figures are not utilized due to their variability, which is influenced by weather-related events and inflow conditions.
Market concentration can be assessed using the Herfindahl-Hirschman Index (HHI), which ranges from 0 (indicating perfect competition) to 10,000 (indicating a monopoly). An HHI score between 1,500 and 2,500 signifies moderate concentration, while a score above 2,500 indicates high concentration. The northern region of Norway (NO4) has an HHI of 2,202, whereas the southern regions have an HHI of 1,279. The Norwegian Competition Authority (NCA) diligently monitors market competition, enforcing disclosure requirements on firms concerning ownership and minority shareholdings to prevent anti-competitive mergers and acquisitions, in accordance with the Competition Act. Additionally, the Norwegian Energy Regulatory Authority (RME) enforces regulations against market manipulation and insider trading, utilizing data analysis to detect any production withholding intended to manipulate market prices.
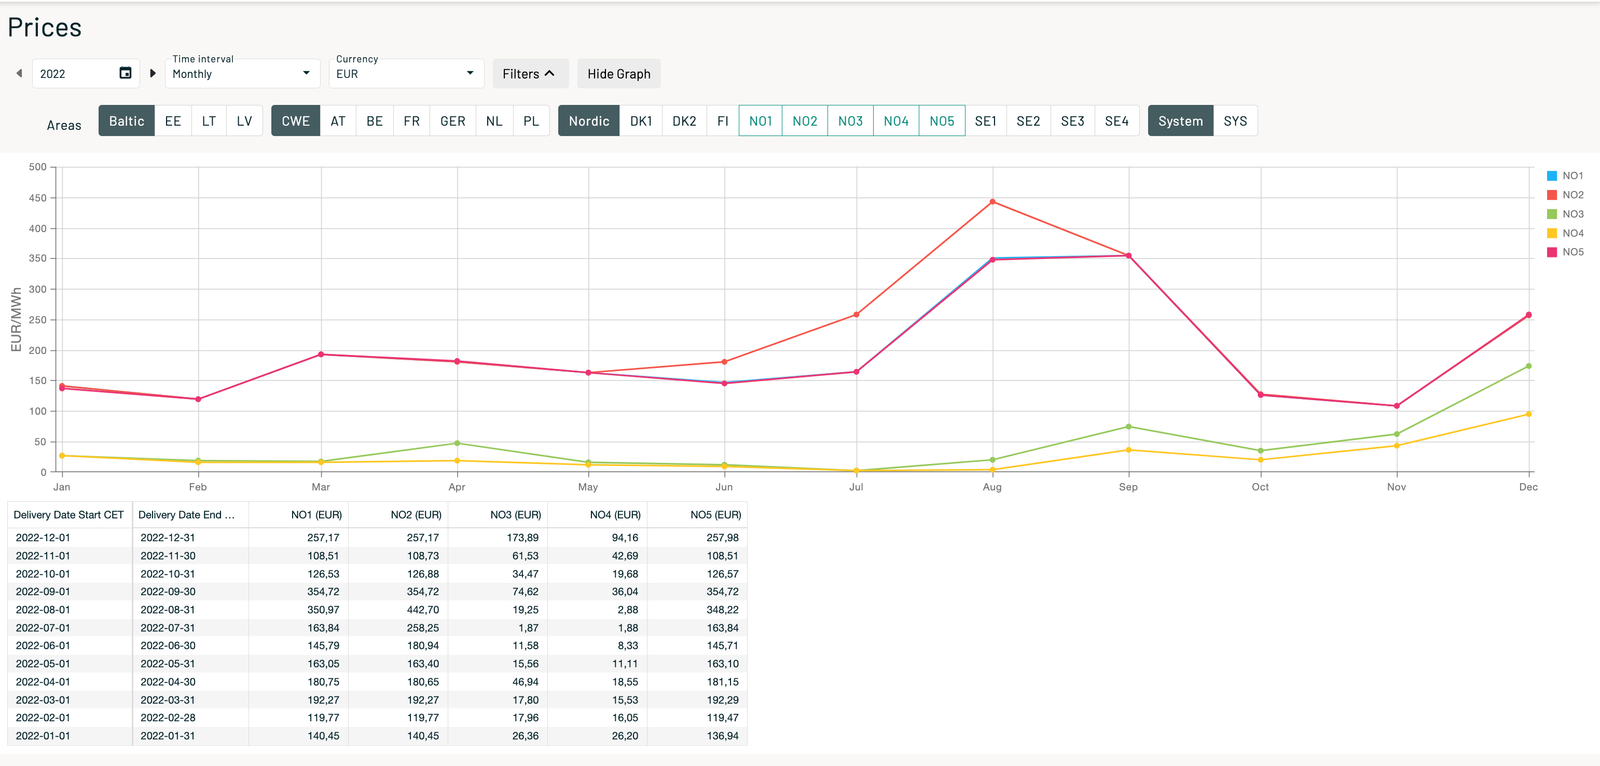
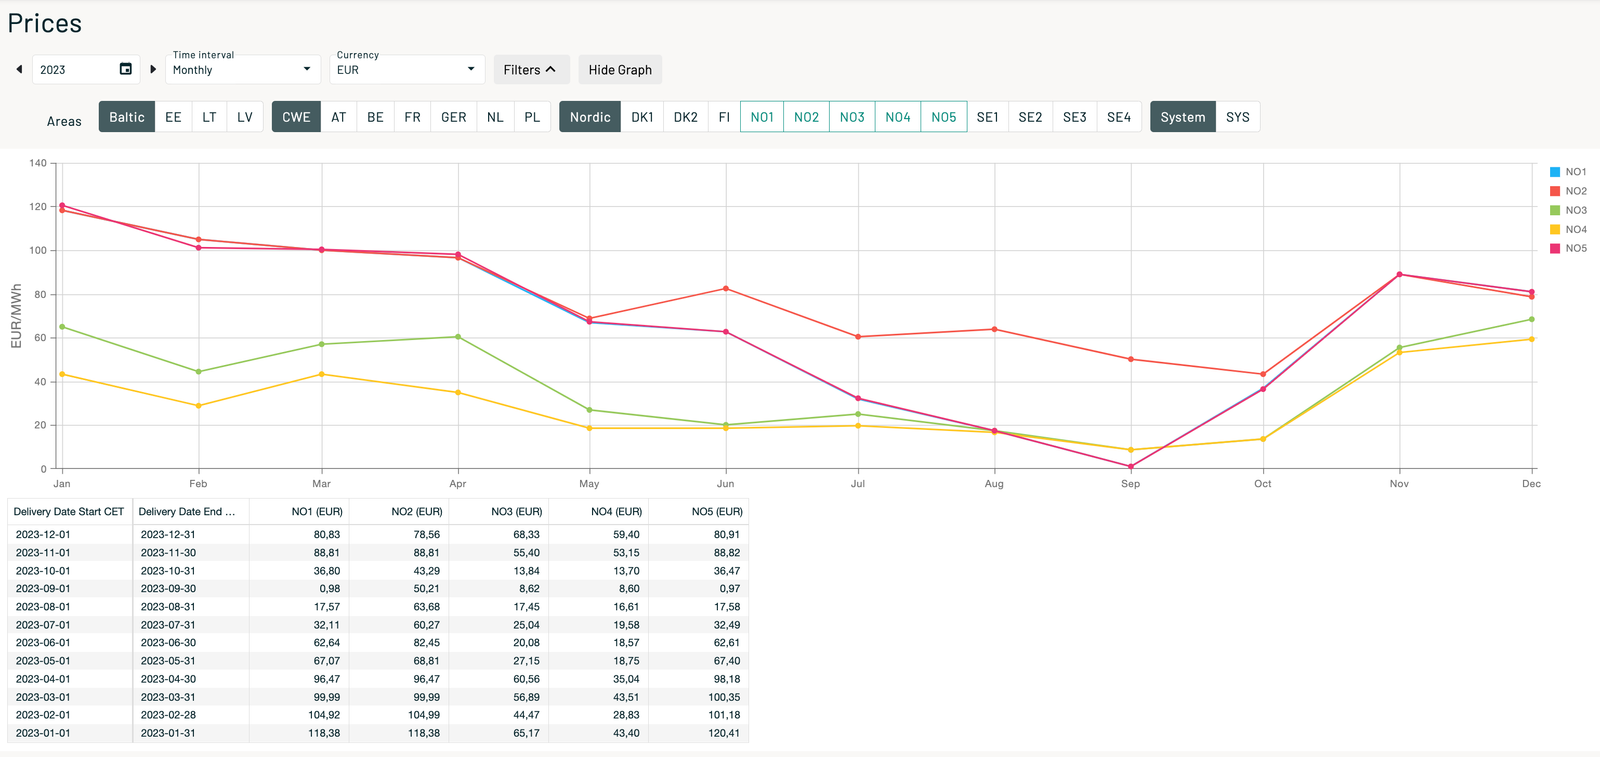
As aforementioned, Norway has been a net electricity exporter for about 17 years of the past 25 years. It has exported on average 10 TWh per year. However, in 2022, Norway, along with many other European countries, experienced a significant price shock. Prices in the Southern Price Area (NO1, NO2, and NO5) escalated from around 140 EUR/MWh in January to as high as 440 EUR/MWh in July and August on the Nord Pool-listed wholesale electricity market. Various factors contributed to this price surge. Firstly, Norway’s primary electricity source is hydropower, and low rainfall in the Southern region, where key reservoirs are located, led to reduced electricity supply. Despite substantial rainfall in the Northern region, transmission between the two areas is often constrained by congestion fees and energy losses over long distances.
Additionally, new interconnection links between Norway and other Northern countries, such as the UK and Germany, resulted in increased electricity exports from Norway, reducing domestic supply and inflating prices. This situation was further exacerbated by the escalation of the Ukrainian-Russian conflict in early 2022, which forced many European countries, including Germany, to reduce their dependence on Russian natural gas. Consequently, Norway became a key energy supplier for the EU market, further amplifying the pressure on electricity prices.
Regarding the retail electricity market, there are over 100 suppliers with high customer turnover rates. Although this suggests significant competition, consumers often find it challenging to accurately compare electricity prices due to varying price components and inconsistent presentations. This creates information asymmetry and a lack of standardized pricing information. Consequently, in late 2022, the Norwegian Competition Authority decided to implement stricter marketing practices and enhance consumer information transparency. As of 2024, there is a Norwegian Consumer Council website that allows consumers to compare all different contracts offered by electricity suppliers.
How much electricity does an average Norwegian household consume? According to Statistics Norway, between 2015 and 2019, average consumption ranged from 16,500 kWh to 17,000 kWh annually. This equates to an approximate monthly consumption of 1,396 kWh (based on a midpoint of 16,750 kWh divided by 12 months). In 2023, the average annual electricity price in Norway, excluding government support, was reported at 1.607 NOK/kWh. This price comprises actual electricity consumption, grid rent, and taxes, resulting in an average monthly expenditure of NOK 2,243 or approximately USD 213.5 (based on an exchange rate of 1 NOK = 0.095193 USD). Including government support of 0.243 NOK/kWh, the average monthly electricity bill would be reduced to NOK 1,904 or USD 181. It is also important to mention that most grid companies have smart electricity meters installed in 98.8% of the measuring points which allows consumers to measure electricity consumption per hour.
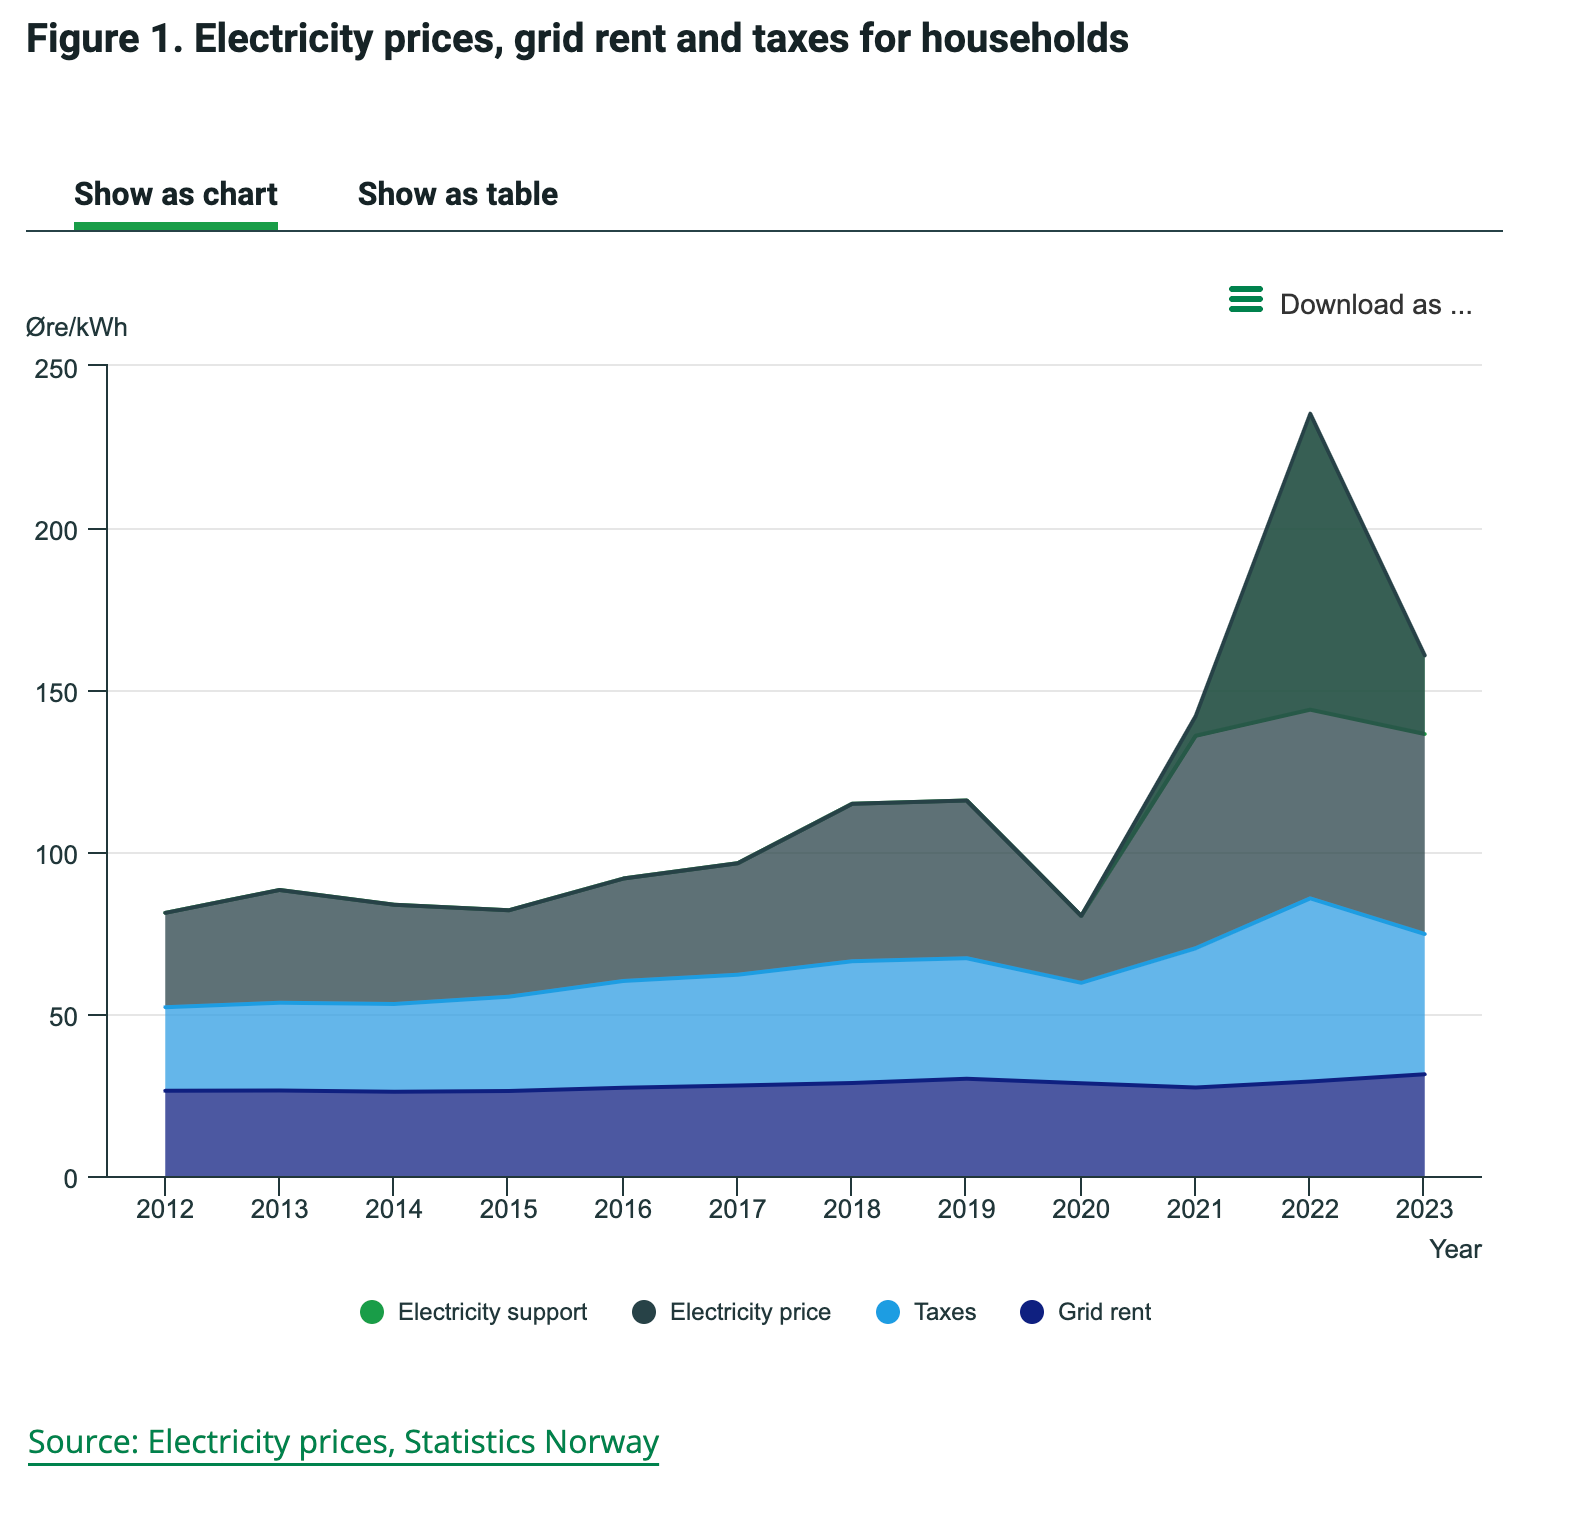
Additionally, in 2022, the total electricity cost per kWh, excluding government support, was 2.353 NOK/kWh, leading to an average monthly expenditure of NOK 3,284 or USD 312. With government support of approximately 0.91 NOK/kWh throughout the year, the effective cost was reduced to 1.443 NOK/kWh, translating to an average monthly expenditure of NOK 2,014 or USD 191 per household. In conclusion, government support was critical in mitigating the price shock to consumers, particularly in 2022, when prices surged dramatically from 0.71 NOK/kWh in 2021 to 1.49 NOK/kWh in 2022.
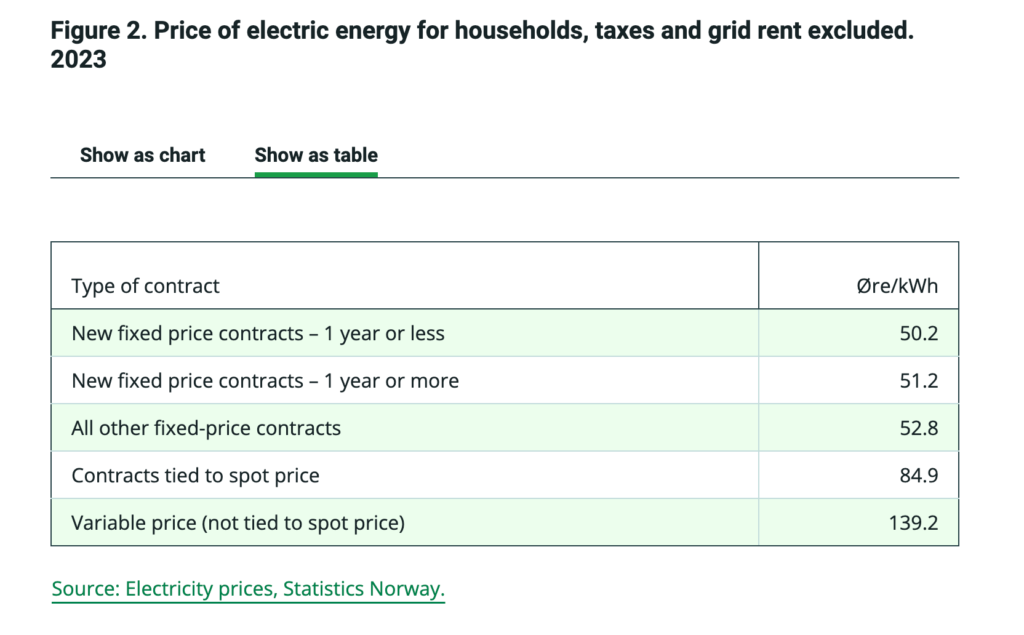
Most Norwegian households opt for spot price contracts for their electricity. In 2023, the average price for these contracts was 0.84 NOK/kWh. These prices are linked to the Nordic Power Exchange (Nord Pool AS), reflecting the combined demand and supply for electricity for the following day. Spot prices and volumes are determined hourly and vary depending on the specific price area. As mentioned earlier, Norway is divided into five areas, each with its own spot prices to account for local conditions and transmission constraints.
There are variable price contracts, which are the most expensive, averaging 1.62 NOK/kWh in 2022 and 1.39 NOK/kWh in 2023, excluding taxes and grid rent. Households with variable price contracts represented only 3.7% of total household consumption in the last quarter of 2023.
Lastly, fixed price contracts offer the cheapest and most stable rates, with contracts lasting one year or less averaging 0.50 NOK/kWh, and those lasting more than one year at 0.51 NOK/kWh. However, many electricity suppliers have stopped offering new fixed-price contracts due to uncertainty about future electricity prices.
Future Outlook
Power trading allows countries to benefit from differences in natural resources, electricity production systems, and consumption patterns. Norway has historically moved power and electricity flows from areas of low-price to high-price areas, thereby meeting demand. Compared to continental Europe, Norway’s energy profile is different due to the high availability of hydropower. This allowed the country to enjoy a flatter daily price profile in the long-term than other countries. Norway has imported electricity from abroad at night time, when prices are low and exported it during the day when prices are higher. The same principle has been applied in wet and dry years.
According to the Norwegian energy agency, electricity prices might peak at around 68 EUR/MWh in 2030, still lower than in 2022. This represents a 60% increase from the 2021 forecast, primarily due to higher gas and carbon prices. As Norway’s power demand continues to grow in the coming years, it is crucial for the country’s energy policy to include power capacity expansion and further integration of the various electricity price bidding zones. Price fluctuations between these areas remain substantial, and transmission is not always guaranteed. Effective rainfall and water management are essential for generating hydropower flexibly, enabling Norway to maintain its status as a leading nation in zero-carbon electricity generation. To mitigate price volatility and reduce dependence on short-term gas-fired power generation prices, Norway must continue investing in renewable energy and local power initiatives to shield the country from European price shocks.
Bibliography
- Energifaktanorge.no. (n.d.). Hydropower is still the mainstay of Norway’s power production. Retrieved from https://energifaktanorge.no/en/norsk-energiforsyning/kraftproduksjon/#:~
=Hydropower%20is%20still%20the%20mainstay,of%20Norway’s%20total%20power%20production - Our World in Data. (n.d.). Net electricity imports. Retrieved from https://ourworldindata.org/grapher/net-electricity-imports?tab=table
- Our World in Data. (n.d.). Per capita electricity generation. Retrieved from https://ourworldindata.org/grapher/per-capita-electricity-generation?tab=table
- Statkraft. (2019). Maintenance ensures eternal life for hydropower. Retrieved from https://www.statkraft.com/newsroom/news-and-stories/2019/maintenance-ensures-eternal-life-for-hydropower/
- Trading Economics. (n.d.). Norway Precipitation. Retrieved from https://tradingeconomics.com/norway/precipitation
- Energifaktanorge.no. (n.d.). Hydropower is still the mainstay of Norway’s power production. Retrieved from https://energifaktanorge.no/en/norsk-energiforsyning/kraftproduksjon/#:~
=Hydropower%20is%20still%20the%20mainstay,of%20Norway’s%20total%20power%20production - Enerdata. (n.d.). World electricity production statistics. Retrieved from https://yearbook.enerdata.net/electricity/world-electricity-production-statistics.html
- The Global Economy. (n.d.). Electricity production capacity. Retrieved from https://www.theglobaleconomy.com/rankings/electricity_production_capacity/
- Investopedia. (n.d.). Natural monopoly. Retrieved from https://www.investopedia.com/terms/n/natural_monopoly.asp
- Nord Pool Group. (n.d.). About us. Retrieved from https://www.nordpoolgroup.com/en/About-us/
- Statistics Norway (SSB). (2023). Lower electricity prices for households in 2023. Retrieved from https://www.ssb.no/en/energi-og-industri/energi/statistikk/elektrisitetspriser/article-for-electricity-prices/lower-electricity-prices-for-households-in-2023#:~
=The%20average%20price%20of%20electricity,67%2C9%20%C3%B8re%2FkWh - OANDA. (n.d.). Currency converter. Retrieved from https://www.oanda.com/currency-converter/en/?from=NOK&to=USD&amount=2014
- Statistics Norway (SSB). (n.d.). Energy consumption in households in Norway. Retrieved from https://www.ssb.no/435431/energy-consumption-in-households-in-norway.gwh-kwh
- Directorate for Financial and Enterprise Affairs Competition Committee. (2022). Working Party No. 2 on Competition and Regulation Competition in Energy Markets – Note by Norway. Retrieved from https://konkurransetilsynet.no/wp-content/uploads/2023/02/Contribution-from-Norway-Energy-markets-DAF-COMP-WP2-WD202222.en_.pdf
- Nord Pool Group. (n.d.). About us. Retrieved from https://www.nordpoolgroup.com/en/About-us/
- Life in Norway. (n.d.). Why is electricity so expensive in Norway right now? Retrieved from https://www.lifeinnorway.net/why-is-electricity-so-expensive-in-norway-right-now/
- Statistics Norway (SSB). (n.d.). Electricity prices. Retrieved from https://www.ssb.no/en/energi-og-industri/energi/statistikk/elektrisitetspriser
- Fry, R., & Tigerstedt, A. (2022). Nordic spot power hits record high average in 2022. Retrieved from Nordic spot power hits record high average in 2022