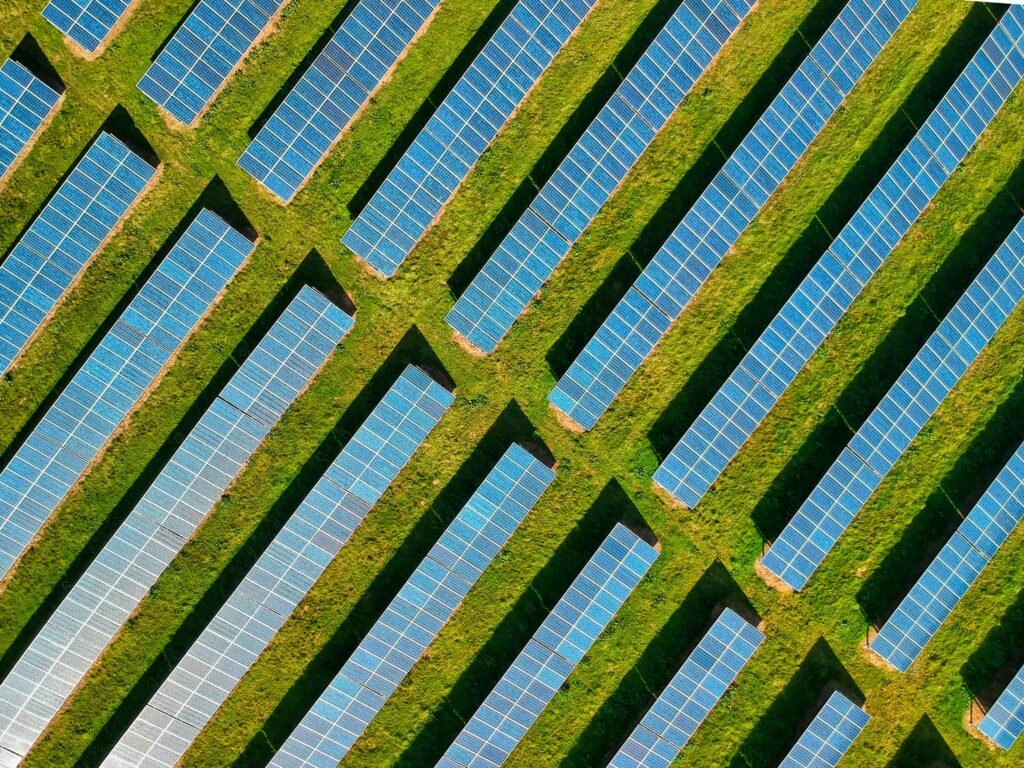
Studying solar energy is critical as it drives the global energy transition by providing clean, renewable, and increasingly cost-effective power. Solar PV represented an impressive three-quarters of all renewable capacity additions worldwide in 2023, with China alone commissioning as much solar PV that year as the entire world did in 2022. By 2028, solar PV is projected to account for 25% of global electricity generation, surpassing nuclear electricity in 2026 and wind electricity in 2028. Its declining costs—solar PV module prices fell nearly 50% in 2023—combined with environmental benefits and the push for decarbonization, make solar energy a crucial area for research and innovation.

How does solar energy production forecasts look like?
The growth of solar energy production is unprecedented, with solar PV installations expected to more than double between 2022 and 2028. By the end of 2024, the global supply of solar PV will reach 1,100 GW, three times the current demand forecast. Declining costs and supportive policies in over 130 countries are fueling this expansion, with utility-scale solar PV projected to generate net savings by 2027. China leads the charge, maintaining 80-95% of global supply chains, while other major contributors like the US, EU, India, and Brazil are rapidly increasing installations. By 2028, wind and solar PV will double their share of global electricity generation to 25%.
What are the drivers of solar energy growth?
Several factors are driving the explosive growth of solar energy:
- Cost Competitiveness: In 2023, 96% of newly installed utility-scale solar PV offered lower generation costs than coal and gas plants, with three-quarters of new solar PV plants providing cheaper power than existing fossil fuel facilities.
- Policies & Incentives: Governments worldwide are prioritizing renewables with initiatives like the US Inflation Reduction Act and the EU’s energy security framework.
- Technological Advancements: Innovations like TOPCon cells (used in 25% of PV modules produced in 2022) and increased efficiency in PV systems are reducing costs and improving performance.
- Global Supply Chain Dominance: China’s massive manufacturing capacity keeps costs lower. Manufacturing costs remain higher in regions like the US (30%), EU (60%), and India (10%) compared to China. These differences could grow to 70%, 100% and 140% respectively by 2028.
These drivers are making solar PV a cornerstone of renewable energy expansion globally.
What are the challenges facing solar energy?
Despite its growth, solar energy faces notable challenges:
- Grid Bottlenecks & Curtailment: High solar PV concentration in certain regions, like China’s north, has led to curtailment rates of up to 18% as of September 2023.
- Permitting Delays: Ground-mounted solar PV project timelines can range from one to five years due to slow permitting processes.
- Market Limitations: Rooftop solar PV growth is outpacing large-scale installations in regions like the EU and Brazil due to high retail electricity prices, while auction prices for utility-scale solar PV have increased in some markets, such as Germany.
Solar PV’s potential is immense. However, addressing these challenges will be critical to unlocking its full role in the global energy transition.
View the source of these statistics and the full report here.
