I decided to change the style of my blog writing. Initially, I aimed to create perfect posts focused on research, facts, and figures. However, I soon realized that this approach didn’t truly reflect who I am. So, I’ve chosen to infuse my personal voice into my blog.
It’s crucial to consult various sources and conduct your own analysis before drawing conclusions. While I still value high-quality research as the foundation for my posts, I prefer to express my thoughts in accessible language that resonates with readers from diverse backgrounds. Whether you’re a sociologist, engineer, teacher, or politician, there’s always something new to learn if you approach it with an open mind.
Although I’m not an environmental engineer, I’m committed to continually learning and honing my skills to create meaningful content for all of you.
Basic Energy Investment Metrics
Imagine today you are assigned a very important task for your fellow citizens: you need to decide which energy investments you will take for the country you live in based on different ratios, variables and metrics in order to serve demand from today up to 2050. Today you will learn the basics of energy economics modeling and I will be guiding you throughout important concepts mentioned in the U.S. Energy Information Administration (EIA) Report for 2022 on “Levelized Costs of New Generation Resources in the Annual Energy” so that once you finish reading the article, you are more than well-prepared to understand such reports and to educate yourself on new concepts and frameworks that will serve you to understand the energy investment choices that our countries make.
To make good investment decisions, we need to understand several aspects of the energy system:
- Demand: understanding historical demand patterns, including seasonality, daily and yearly fluctuations as well as future trends based on technology, energy-intensity usage, standards of living projections and industrial development of the nations.
- Current supply: what is currently being supplied, from each source and at which rates and the level of grid congestion and risk of disconnection. Basically in developed countries, they are trying to balance cost with availability and environmental targets with renewables.
- Capacity assessments of different technologies (defined by the EIA as the ratio of the electrical energy produced by a generating unit for the period of time considered to the electrical energy that could have been produced at continuous full power operation during the same period).
We need to consider the cost of supplying electricity as well as the cost of storing that electricity in case we are dealing with non-dispatchable plants such as solar photovoltaics (PV) or wind technologies. These technologies are also known to be intermittent, because as humans we have no control over when the electricity will be generated. We can make the best projections and forecasts but they will never be completely accurate. Weather is highly unpredictable and this creates challenges to fully rely on renewables for serving base loads (i.e. the “minimum” constant electric supply needed for a specific region or area in a country). Therefore, we could argue that renewables are nice to have, but they are not enough as of today to serve our energy demands.
The concept of intermittent generating technologies is closely linked to the duty cycle. In electric engineering, it is defined as the ratio of time a load or circuit is ON compared to the time the load or circuit is OFF. The duty cycle of base load technologies is therefore much higher than those from renewable sources such as wind and solar.
To measure costs, EIA’s National Energy Modeling System (NEMS) uses a popular metric known as “levelized cost of electricity” (LCOE). This measures the amount of revenues needed to breakeven and cover the costs of building and operating a generator over a specific period. In addition, the levelized avoided cost of electricity (LACE) is another useful metric that measures that revenue available to the generator during that same period. In other words, LCOE measures the amount of money you need to make to make the investment worthwhile and LACE measures the upside potential revenues that you would earn if you decided to invest in the generator. If you forecast high electricity prices and strong winds during the project life period, the onshore wind projects could be an option for you as an investor. Lastly, the levelized cost of storage (LCOS) measures the amount of revenues you need to have to build and operate a battery storage technology during its useful life. It is similar to LCOE but it is modeled differently given its unique nature. A battery-like technology is typically modeled either as a factor that adds “capacity” to the grid to serve demand during peak load periods (when there is high demand of energy from consumers) or it can be seen as give and taker from the grid that uses price arbitrage for its own energy supplies. For example, a battery can recharge (or take energy) during low-price generation electricity periods and provide energy during peak loads, thereby making a profit on those differences while at the same time serving as a buffer for load balancing (matching supply and demand of electricity).
Investors and financial analysts love ratios. Ratios are an easy way to measure different aspects of a product’s profitability compressed in a single number. In this example, we could take the ratio of LACE-to-LCOE which essentially is a value-to-cost ratio. If we have two investments and one has a higher LACE-to-LCOE ratio, we would pick that one assuming other factors are constant and there are no other extra costs or regulatory constraints for example.
The paper we study in this article published by the EIA looks at electric generating technologies entering into service in 2024, 2027 and 2040 using a capacity-weighted and a simple average of the regional U.S. values across 25 U.S. supply regions of the NEMS Electricity Market Module (EMM). Essentially we will learn about the costs and revenues that each electricity generating technology has in the coming years and learn how the EIA looks at those decisions.
Cost Factors to Measure
I. Taxes
Government support via subsidies, tax-exemptions and tax credits have big implications in energy cost modeling [1]. In the U.S. for example, as an investor, you might be entitled to a production tax credit (PTC) or an investment tax credit (ITC).
A PTC helps to reduce the cost of energy production and it incentivizes the energy company to generate as much energy as possible. In 2021, if your investment generated electricity from wind, geothermal and closed-loop biomass plants (1), you could receive a tax credit of 25 USD/MWh. Other PTC-eligible technologies received 13 USD/MWh. Wind generated sources built before the end of 2016 received full PTC and these incentives decline as we move towards the future with sliding schemes (reducing every year the incentive for example). Most of the PTC are inflation-adjusted.
An ITC helps businesses deduct a certain percentage of investment costs from their taxes. In the U.S., all solar projects coming online before Jan 2024 are entitled to 30% ITC and then progressively phased down to 26% in 2024 and 2025. Batteries are a special case because when they are standalone and they are just simply connected to the grid (no generation, just recharge and load), they are typically not eligible for ITC. However, co-located batteries on a PV solar facility tend to be eligible for ITC.
Onshore and offshore wind projects can apply to ITC or PTC. However, it makes more sense for costly offshore wind projects to apply for an ITC to help reduce the initial large investment costs. In their paper, they assume 30% ITC eligibility if placed in service before December 2035.
|
[1] Are subsidies always helpful? From a societal perspective, Hulsof et. Mulder (2022) in their research paper on “Design of Renewable Support Schemes and Windfall Profits: A Monte Carlo Analysis for the Netherlands” talks about the concept of windfall profits in renewable energy projects. Their findings state that information asymmetries between investors and governments allow investors to make excessive profits mostly driven by government subsidies which eventually bear a cost to taxpayers in society. The concept of windfall profits in renewable energy projects centers around the relationship between subsidies and the Levelized Cost of Electricity (LCOE). LCOE represents the complete life-cycle costs of generating electricity, spreading the net present value across the system’s lifetime. According to the DOE US Energy Information Administration, this includes capital costs, fuel, operations and maintenance, financing, and utilization rates. A critical balance exists in subsidy pricing: setting them above LCOE attracts investment but burdens households, while setting them below LCOE deters investment. The Dutch feed-in premium (FiP) scheme offers an instructive case study in subsidy evolution. Unlike feed-in tariffs (FiT) which provide fixed payments, the FiP system allows generators to sell electricity on the market while receiving additional premiums. The system evolved through three phases: MEP (2003-2006) with fixed, unadjusted premiums; SDE (2008-2010) with sliding premiums based on electricity prices; and SDE+ which incorporated wind speed variations at different locations. By 2018, this approach to renewable energy subsidies had been adopted worldwide, with 111 out of 135 countries implementing similar regulatory policies. The Dutch government’s NPV approach considered both fixed costs (initial investment, depreciation, loan interest, taxes) and variable costs (maintenance, production), alongside revenue factors like market price forecasts and capacity. Project assessment required detailed data on full-load hours, power output formulas, turbine heights, maintenance downtimes (approximately 2%), and turbine lifetimes. Analysis of the subsidy distribution showed significant evolution: in 2003, 81% of projects received more subsidy than needed, with average windfall profits of €2.42 ct/kWh. By 2009, this decreased to 76% of projects, though relative windfall profits increased to 38%. By 2018, under the SDE+ scheme, only 68% of projects received excess subsidies, with windfall profits declining to €0.85 ct/kWh (32% of subsidy value). This trend demonstrates increasingly effective targeting of subsidies, though some level of windfall profits persisted throughout the program’s evolution. |
II. Technology
Understanding the value that an additional generator plant brings to the grid is essential to understand investment dynamics. It is not sufficient to be cost-competitive only, but also to understand how much of the energy produced can you actually sell to the grid?
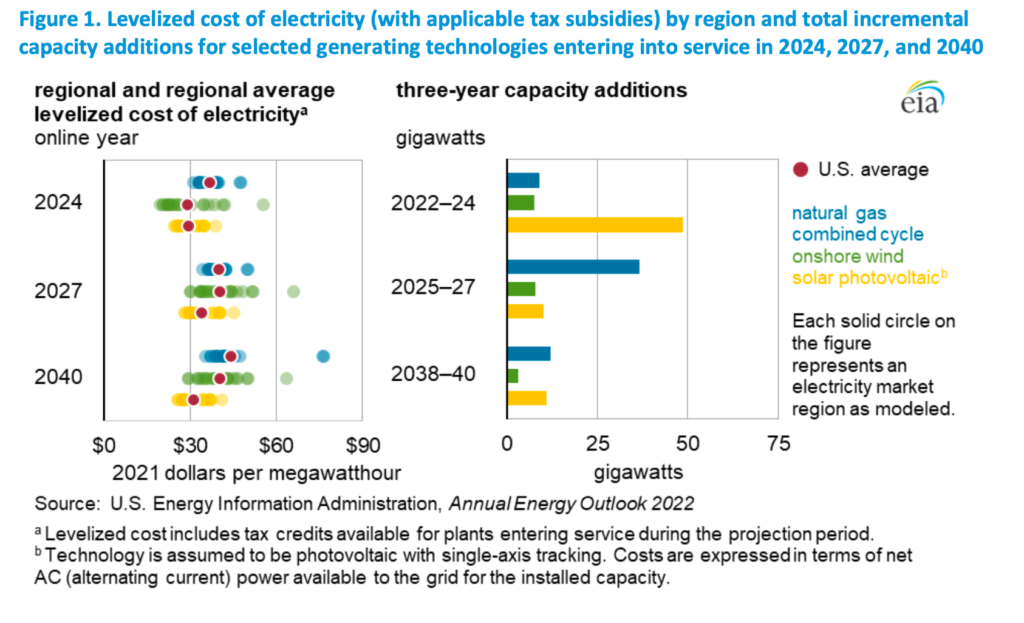
In the graph below, you can see that while solar PV has the lowest LCOE during 2027 and 2040, between 2025 to 2027, investments in natural gas combined cycle (CC) are going to be the preferred choice adding to around 35 GW of capacity compared to around 10 GW of solar only. This has to do with the fact that CC plants are dispatchable in nature and they are more suited to serve base load demand.

Figure 1 shows that solar PV and onshore wind have the lowest levelized cost of electricity. This metric is measured over the entire project useful life (30-year) discounted at a WACC rate of 6.2%. However, as an energy finance modeler you should be cautious with forecasts. New regulations and technology developments move at a fast pace and estimates might need to be annually updated based on the latest information available. The parameters used by the EIA are based on historical data gathered from available technologies in the electricity market module (not from residential or commercial applications).
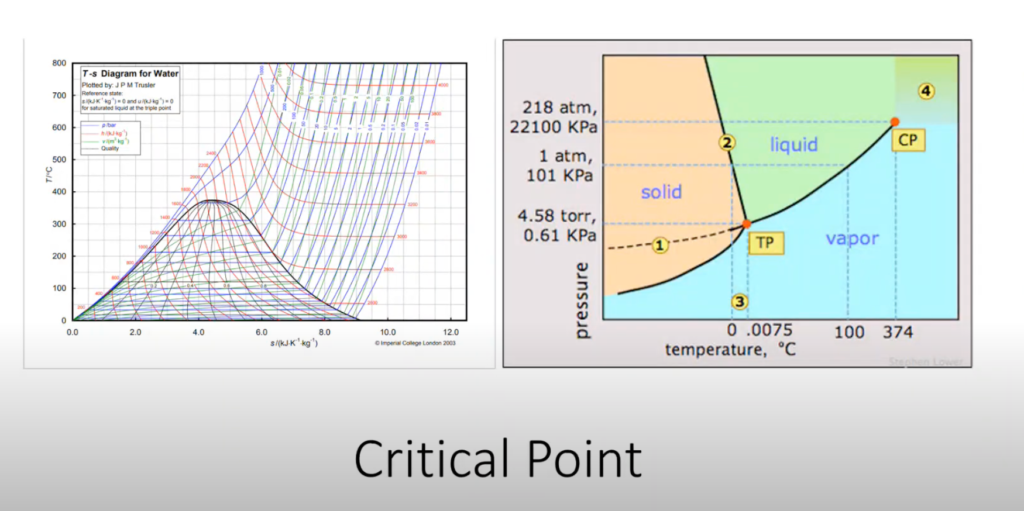
The EIA also mentions that one of the most effective ways to reduce greenhouse gas emissions is to install carbon capture and sequestration (CCS) [3] technologies in ultrasupercritical (USC) coal generation technologies [2]. Currently their models include 30% and 90% CCS USC plants.
|
[2] Carbon Capture and Sequestration Technologies (CCS) CCS technologies involve capturing and filtering the CO2 emitted from factories or power generating units such as hydrogen, steel or cement production; transporting it through pipelines or tankers and then storing it permanently deep underground. Carbon emissions are typically stored in saline aquifers due to high pressure capacities or in depleted oil and gas reservoirs, typically 1 km under the ground. Examples of such projects include the Zero Carbon Humber where CO2 is stored in the aquifer named ‘Endurance’ in the UK or the Citronelle Project in Alabama, U.S., where CO2 injection goes as deep as 2.9 km underground. Capturing CO2 and storing it is one method of preventing greenhouse emissions but there are alternative solutions such as re-using CO2 for alternative processes. |
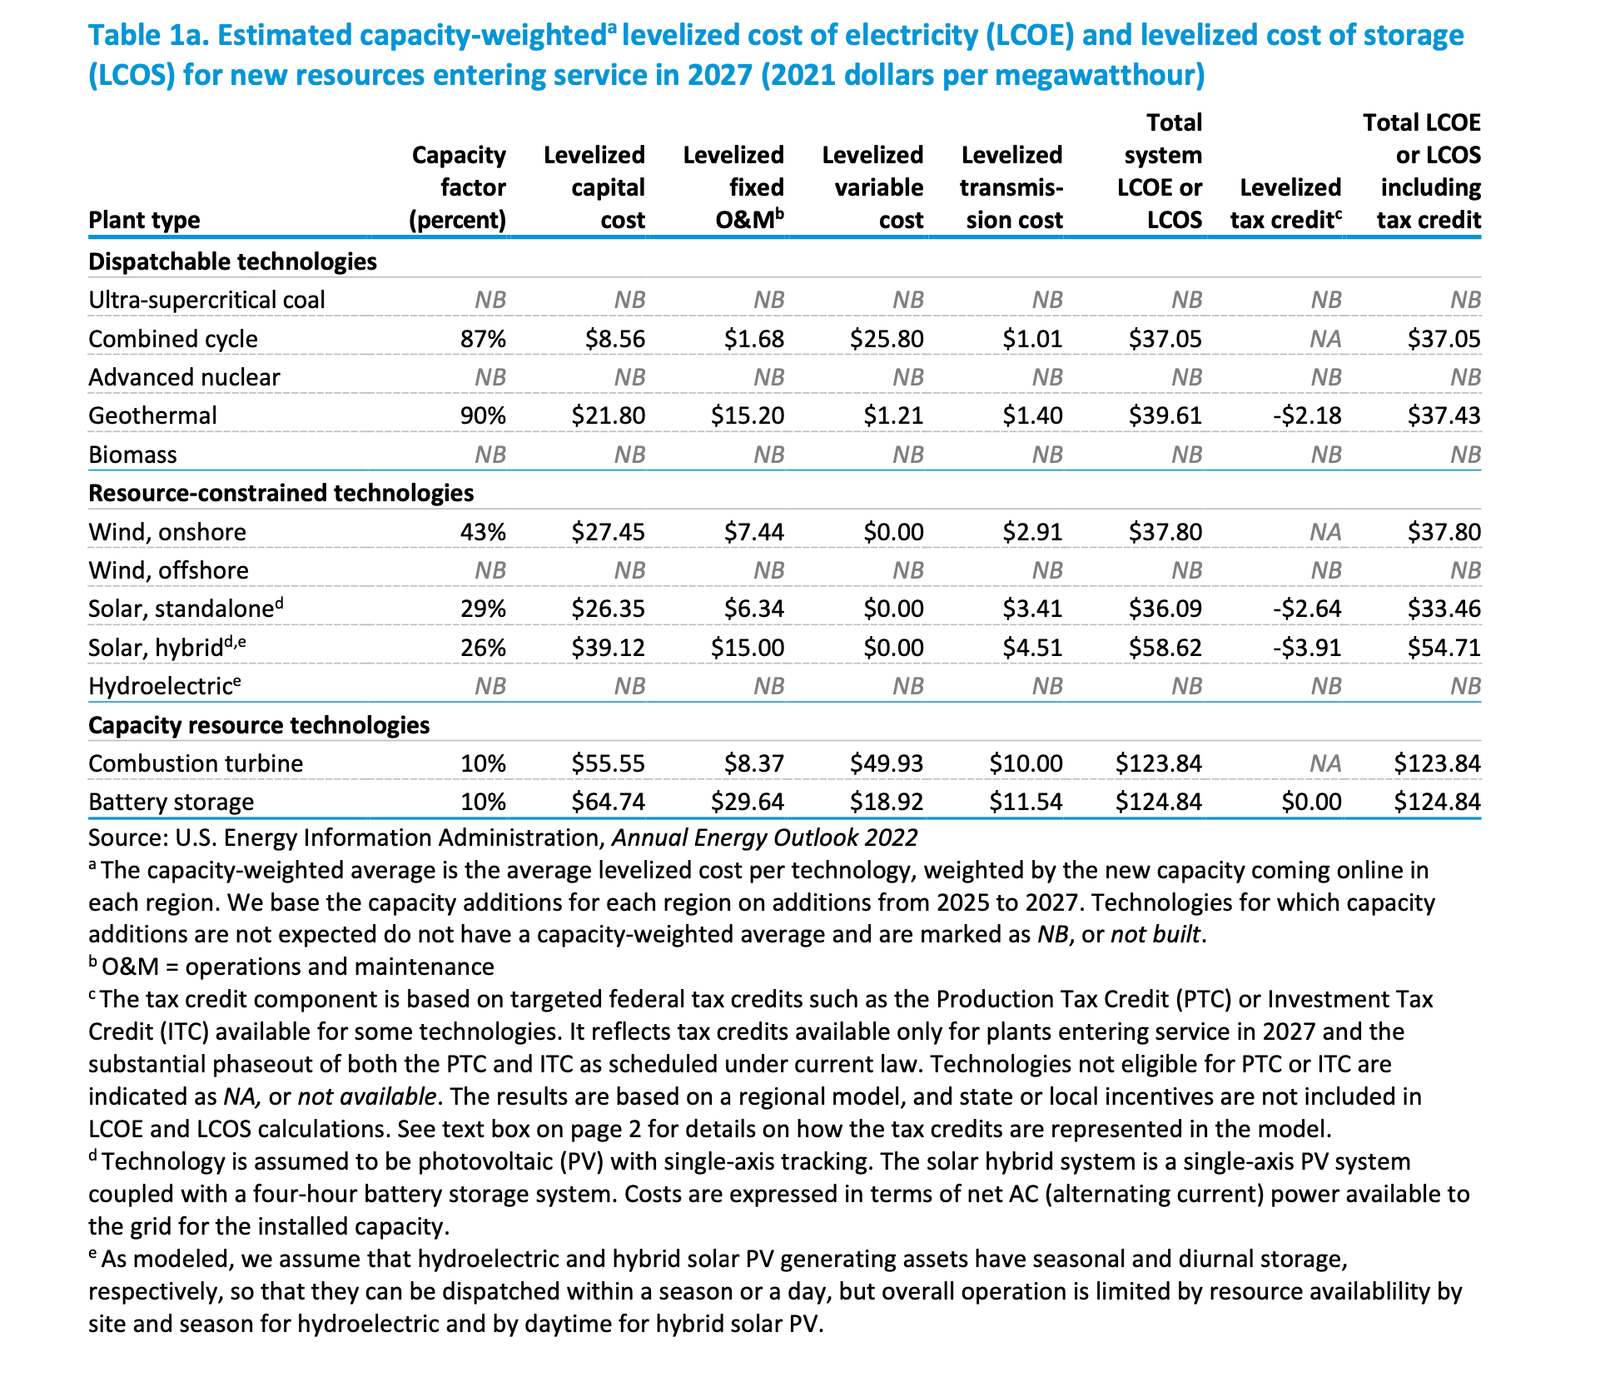
If we have a look at table below developed by the U.S. EIA, we can derive key insights:
- We are differentiating between dispatchable, resource-constrained and capacity resources technologies. Remember, dispatchable means that we can generate whenever we decide to; resource-constrained means that we need the “resource” in order to operate and it falls outside our control (we can’t control wind speeds for example) and capacity resource means that they act as load balancers.
- New combined-cycle [4], geothermal, wind onshore, standalone solar, hybrid solar [3], combustion turbines and battery storage are expected to enter service in 2027.
The variability of capacity factors is clear. While combined-cycle and geothermal technologies are highly reliable, others such as wind and solar have much lower capacity factors. Lastly, capacity resources technologies have capacity factors of only 10% which means that they are only used during peak loads and specific emergencies I would say.
It is also interesting to see the differences in costs per plant type. Combined-cycles have a very low levelized capital cost compared to the rest but they entail high relative levelized variable cost. On the other hand, wind and solar have low variable costs and relative medium levelized fixed O&M expenditures. Geothermal has relative high capital and fixed O&M costs but low variable costs.
Solar hybrid is the most expensive among new resources being added in the resource-constrained technologies. However, combustion turbines and battery storage have really high LCOE costs in general compared to the rest.

|
[4] Combined-Cycle Gas Turbine This type of technology is more efficient than single gas turbines because it uses a heat recovery system that consists of two turbines: the gas turbine and the steam turbine. First, fuel is burned which powers two turbine generators to produce electricity. From this process, heat is recovered from the two steam generators which boil water and generate steam which spins a steam engine to generate extra electricity. The water is then condensed and it is ready to be recycled again for reuse. |
|
[5] Hybrid Solar Most homes receive energy in form of AC current from the grid. A hybrid solar system comprises of your solar panels at home, a battery and then your connections to the grid. When your solar panels receive sunlight, it generates DC current which then needs to be either sent to the batteries directly (which also use DC power) or they need to be converted into AC which can then power your home equipment. What makes it hybrid though, is that it has the capability of directing in a smart way excess energy back to recharge the batteries or sell it back to the grid. Likewise, when there is a power outage, the system might use the stored energy in the battery to power essential home utilities. These new systems typically come integrated with apps that users can use to monitor usage, power drawn and sent from/to the grid. |
Conclusions
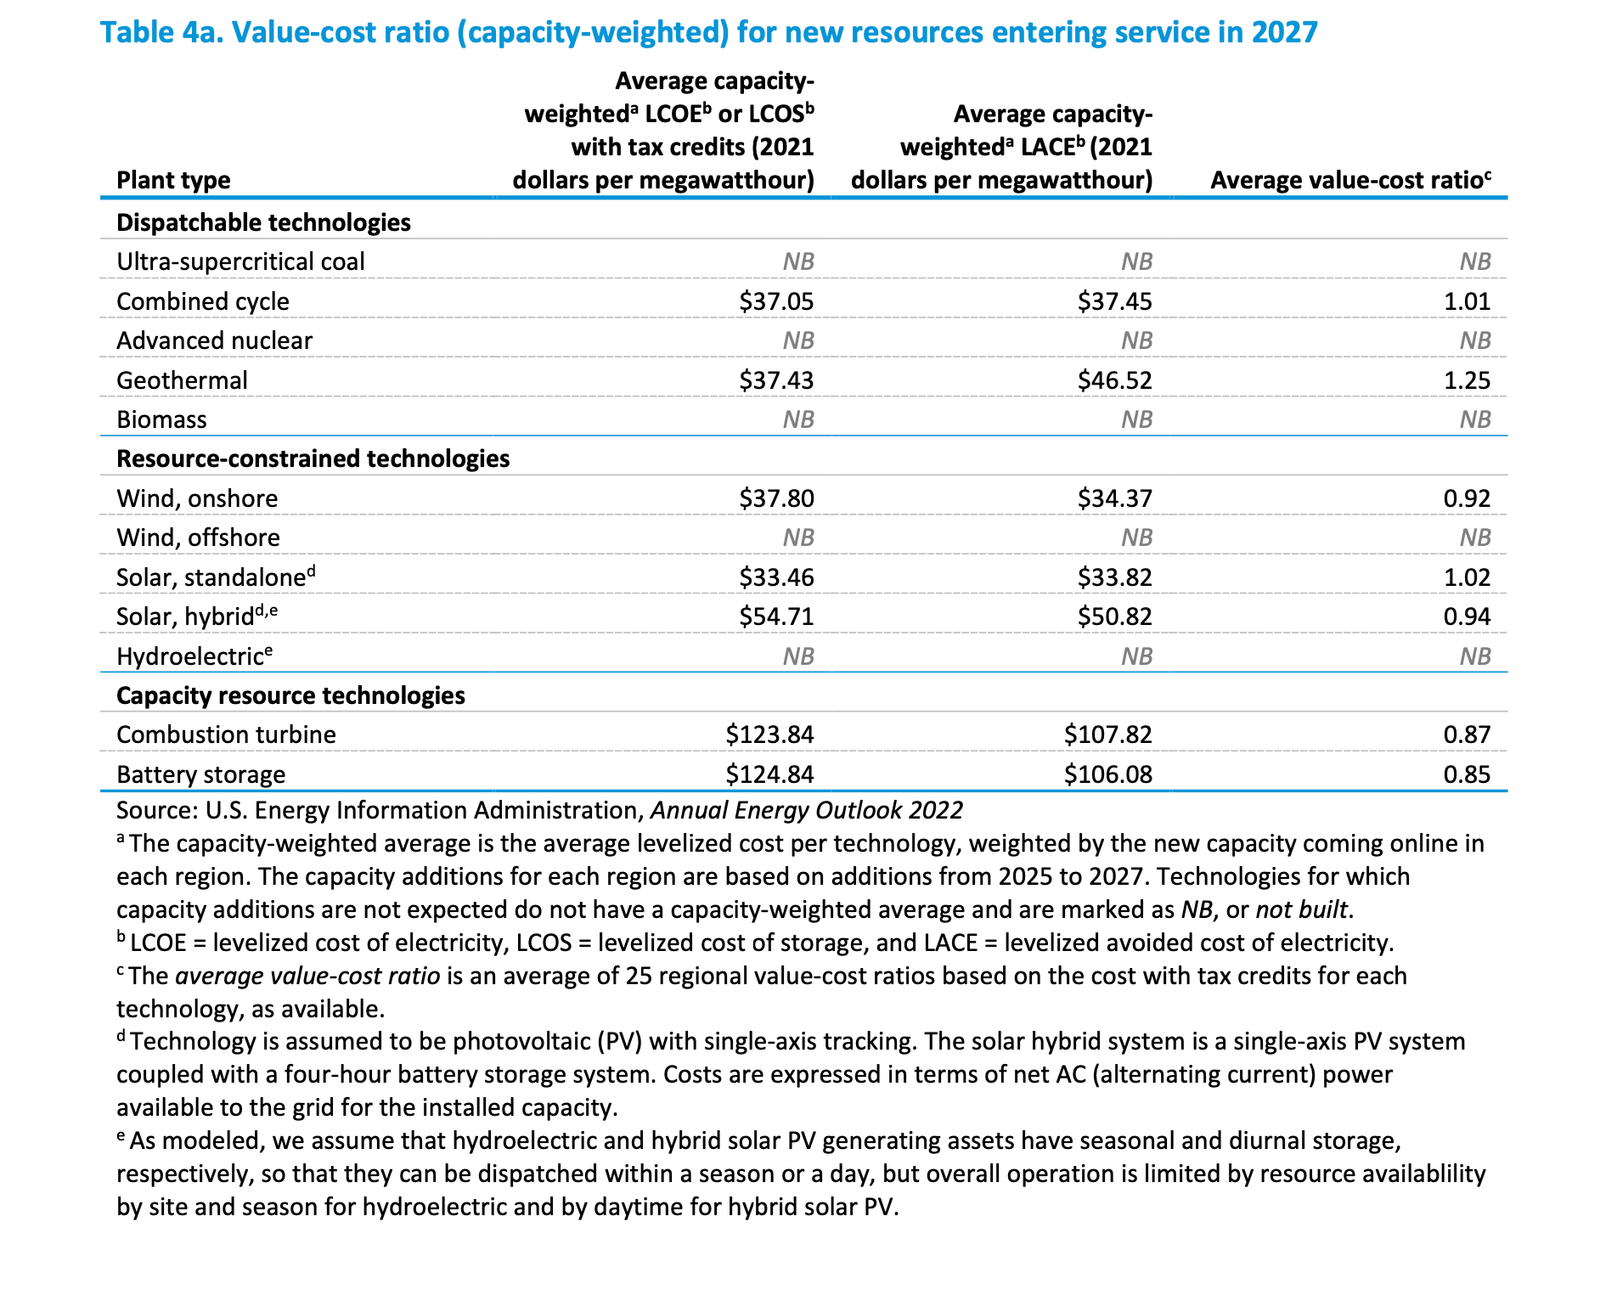
The objective of this article was to introduce essential energy modeling concepts, variables, and factors that influence the economic viability of investing in new generating capacity technologies. Previously, I emphasized the significance of analyzing the LACE ratio in conjunction with the LCOE. Consequently, I would like to present Table 4a from the EIA report, which illustrates the value-to-cost ratios for various generating technology power plants expected to come online between 2025 and 2027. It is crucial to note that this article considers capacity-weighted values rather than simple averages. This approach is adopted to evaluate the cost of a marginal addition of generator technology, with the aim of selecting the option that: a) maximizes revenue throughout the project’s useful life, and b) incurs the lowest relative costs.
As indicated in the table below, geothermal energy exhibits the highest ratio at 1.25, suggesting that this technology will be deployed in economically viable locations. Additionally, combined-cycle technology ratios exceed 1, indicating that these new additions are generating economic value beyond their development and maintenance costs.

The EIA presents intriguing energy projections:
- Solar power and onshore wind costs may temporarily rise as tax credits from the U.S. government are phased out. However, over the medium to long term, the levelized avoided cost of electricity is anticipated to decline. As more capacity is installed and these technologies operate concurrently (primarily during daylight hours), market saturation is likely to occur, resulting in lower electricity prices in the long run.
- Wind LACE values are expected to increase as technology advances, making the installation of onshore and offshore wind turbines more cost-competitive. Furthermore, if load demand rises due to population growth and urbanization, or if fuel costs escalate due to shortages, wind energy is poised to become a viable intermittent energy alternative.
- Battery storage is projected to benefit from recharging during low-cost daylight energy generation periods, attributed to increased solar PV availability. This storage will be able to discharge energy to the grid during peak loads, when electricity prices are high.
- Combined cycle technologies are expected to maintain stable LCOE and LACE ratios. However, costs may vary by region; for instance, in California, costs are likely to increase due to policies aimed at phasing out fossil fuels.
I would also like to highlight a critical aspect of market dynamics mentioned in the EIA report regarding the breakeven point of generator technologies. When value-to-cost ratios exceed 1, it is believed that the market will self-correct as investments in that particular technology align with load growth until ratios begin to decline due to saturation or crowding out. This phenomenon is akin to a market where multiple vendors sell the same product; as availability increases, prices generally fall and the product’s value diminishes. Conversely, for value-to-cost ratios below 1, the EIA posits that over time, technological advancements, regulatory changes, or other external factors may enhance the ratio of those technologies, thereby affecting the costs or the value of the electricity they generate.
Resources & Bibliography
Tennessee Valley Authority. (n.d.). How a combined cycle power plant works. TVA. Retrieved from https://www.tva.com/energy/our-power-system/natural-gas/how-a-combined-cycle-power-plant-works
IPIECA. (2022). Combined cycle gas turbines: 2022. IPIECA. Retrieved from https://www.ipieca.org/resources/energy-efficiency-compendium-online/combined-cycle-gas-turbines-2022
National Grid. (n.d.). What is CCS & how does it work? National Grid Stories. Retrieved from https://www.nationalgrid.com/stories/energy-explained/what-is-ccs-how-does-it-work
GreenFacts. (n.d.). Supercritical and ultra-supercritical technology. Retrieved from https://www.greenfacts.org/glossary/pqrs/supercritical-ultra-supercritical-technology.htm
U.S. Energy Information Administration. (n.d.). Glossary: Capacity factor. EIA. Retrieved from https://www.eia.gov/tools/glossary/index.php?id=Capacity_factor
Panasonic. (n.d.). What is a hybrid solar system & how does it work? A guide. Green Living by Panasonic. Retrieved from https://green-living.na.panasonic.com/articles/what-is-a-hybrid-solar-system-how-does-it-work-a-guide
U.S. Energy Information Administration. (2022, March). Levelized costs of new generation resources in the annual energy outlook 2022. EIA. Retrieved from https://www.eia.gov/outlooks/aeo/pdf/electricity_generation.pdf


